Copper blog
Productivity
The AI tech stack for mid-sized agencies
Compare the top AI tools for creative agencies, from CRM and content creation to project management and workflow automation.

Productivity
What Google Workspace teams should know about CRM data ownership
When you put your data into a CRM, does it stay yours? Here's the CRM data ownership question every team should ask, plus four things to check before you commit.

Productivity - 10 min READ
CRM vs project management: Which one do you actually need?

Productivity - 5 min READ
The best CRM for agencies (and how to choose the right one)
The best CRM for agencies isn't the one with the most features — it's the one your team will actually use. Here's how to choose, and why Copper fits agencies that run on Google Workspace.
Productivity - 7 min READ
Top 5 folk CRM alternatives in 2026
Looking for a folk CRM alternative in 2026? We broke down the top 5 options.
Get the latest from our blog every month
Browse the blog
Want to go deeper? Click on a category below for more from Copper.
Popular

8 min READ
5 Ways to use Pipeline email automations that save your team time
Save hours with smarter email follow-ups that scale with you and help you never miss a beat
8 min READ
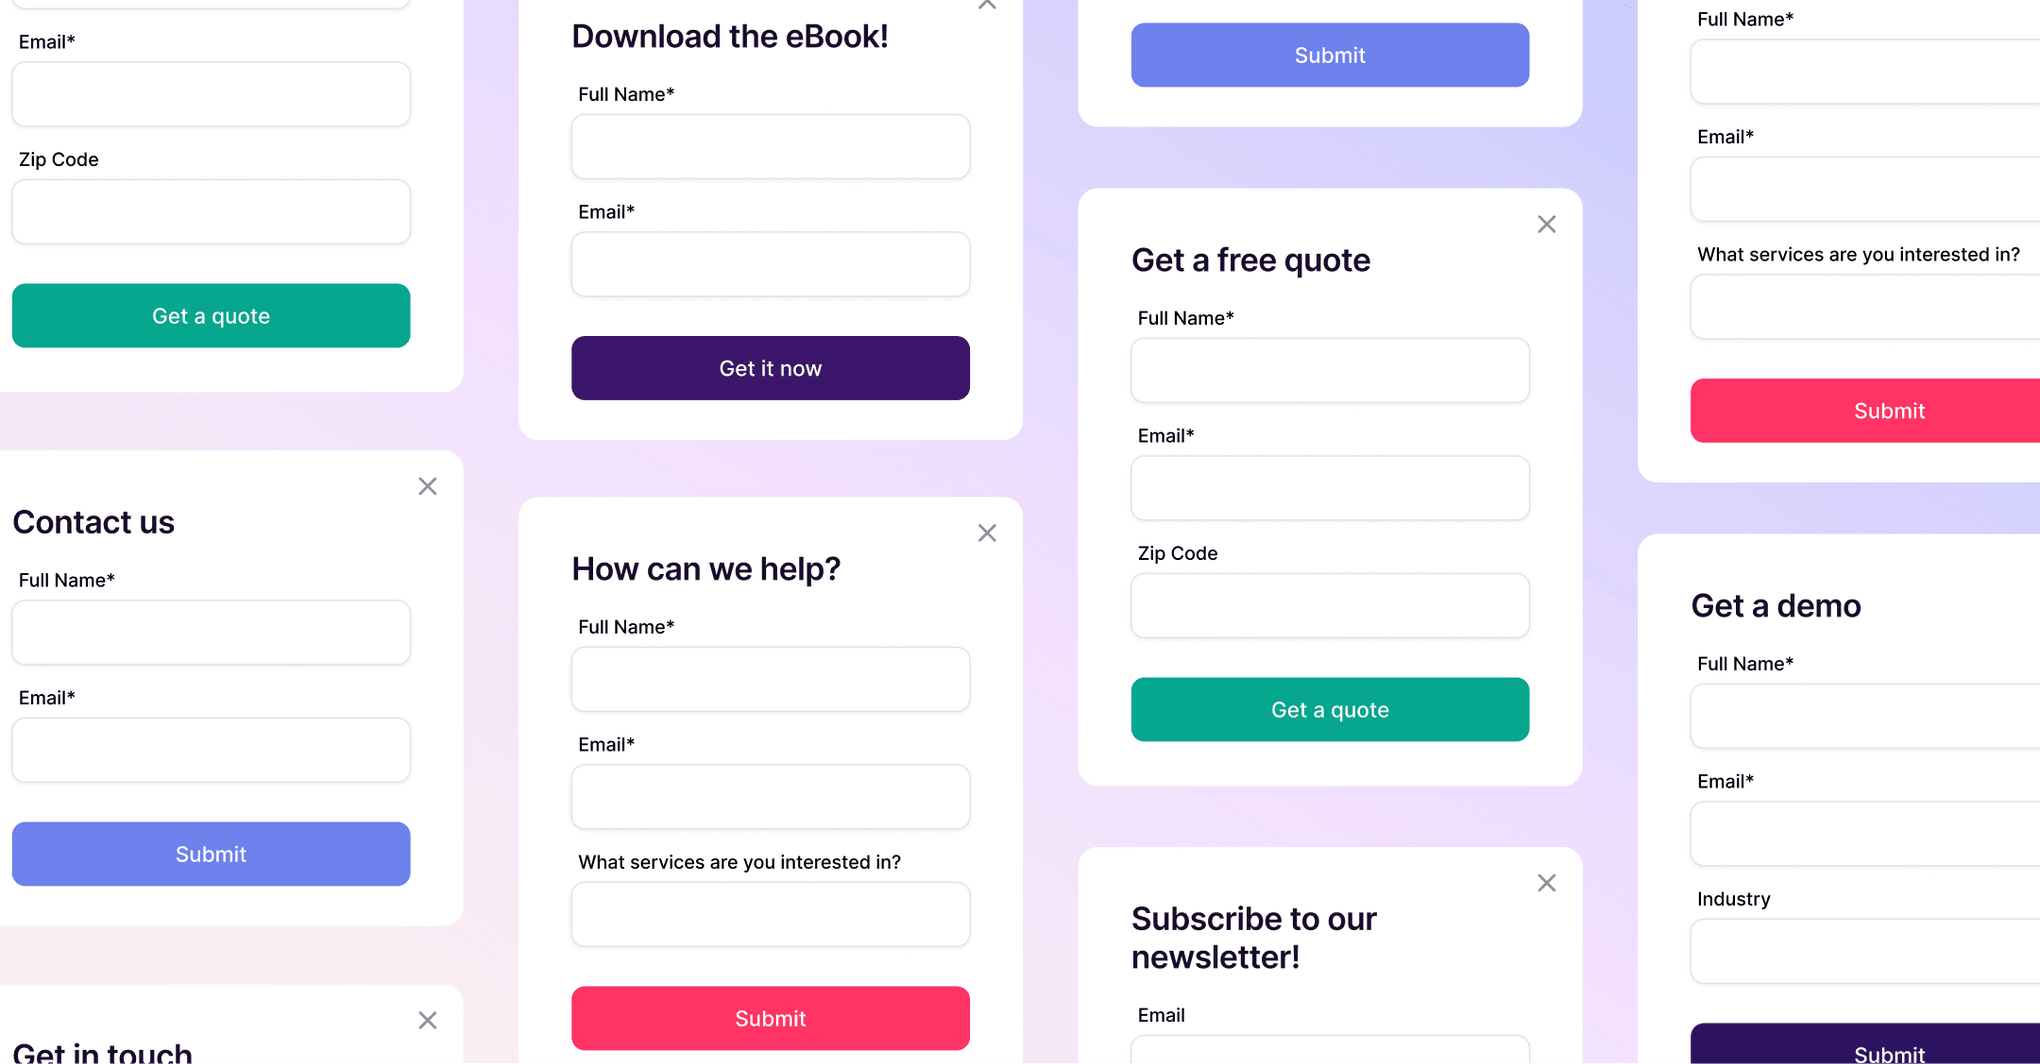
5 Forms you need on your website to capture more leads
Capture more leads, automate follow-ups, and keep your pipeline full with these must-have website forms.

4 min READ
How to use your CRM for project task management: 5 use cases
Simplify your workflow: Discover 5 ways small businesses use CRM project task management to track tasks, clients, and projects efficiently.

6 min READ
You’re not ‘too small’ for a CRM
Struggling to stay organized? A CRM might be your best next move.

Productivity - 7 min READ
What agencies get wrong about AI adoption
Most agencies are "doing AI" wrong. Learn the 4 mistakes impacting your ROI and how CRM-connected AI actually helps agencies work smarter.

Sales - 7 min READ
New ways to upsell agency services that add value
Discover smarter ways to upsell by adding value, not pressure.

7 min READ
Top 6 things to look for in a CRM for agencies
Discover the must-have features in a CRM for agencies. Learn how the right CRM can boost team communication, automate tasks, and empower your agency to grow.

Sales - 9 min READ
Need to build client relationships? Here's how
Learn how to build and maintain valuable client relationships that promote long-term growth.

4 min READ
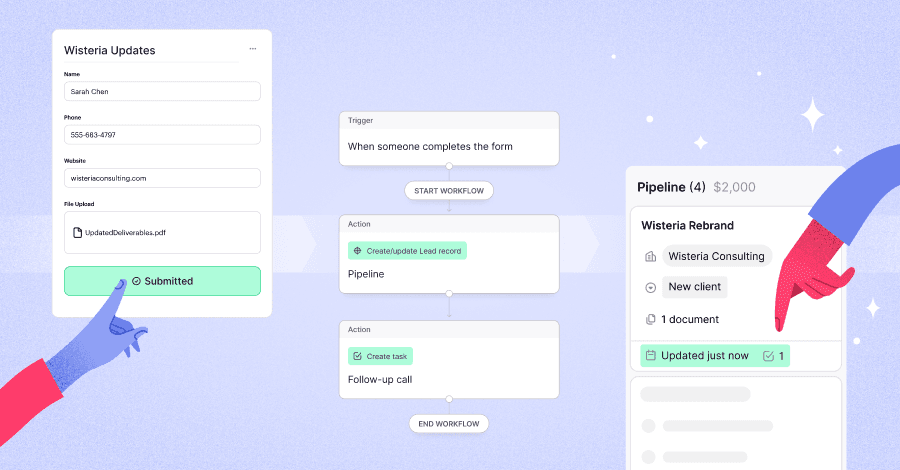
HubSpot forms create records - Copper forms keep your Pipeline moving
Learn how to use forms across the full customer lifecycle, from lead capture and onboarding to project updates and follow-up. Discover how Copper forms help teams create records, update pipeline records, and keep workflows moving.

Productivity - 7 min READ
5 best Attio alternatives in 2026
A CRM shouldn’t feel like another full-time job. Compare five tools that simplify client management, automate busywork, and fit your workflow.

Marketing - 6 min READ
Short-form video in marketing: Why it works and how to use it
hort-form video is dominating social feeds — here's why it works, what the ROI looks like, and how to build it into your content strategy.

Sales
Opportunity management in CRMs and 2026 best practices
Boost forecast accuracy and close more deals with smarter CRM opportunity management, AI automation, and better pipeline visibility.
Productivity
5 ways to use forms across your entire client lifecycle
Most forms stop at intake. These don’t. Explore 5 ways connected forms can create records, update pipelines, trigger follow-up, and keep work moving across the customer lifecycle.

Productivity - 10 min READ
Lead management in CRM: Best practices for building stronger customer relationships
Learn how to organize leads, automate follow-ups, and build stronger customer relationships with the right CRM strategy.

Productivity - 7 min READ
Why relationship intelligence is the advantage most teams are missing
Discover how relationship intelligence improves your CRM, strengthens client relationships, and helps your team drive retention and growth.

6 min READ
How to use Google Sheet CRM templates
Download Copper's free CRM Google Sheet template and learn how to set it up step by step. Track leads, contacts, and deals without any paid tools.

Productivity
Top 10 CRM issues businesses face and how to solve them
Struggling with CRM issues? Fix messy data, low adoption, broken workflows, and turn your system into a reliable, growth-driving tool.

Productivity - 6 min READ
You closed the deal — so why does everything slow down after?
From bid to build, Copper and Timmy help keep your projects connected so your team can move smoothly from kickoff to delivery.

Productivity - 8 min READ
5 of the best task management CRM software in 2026
Tired of juggling tools? Discover CRM and task management software that keeps your work, deals, and follow-ups all in one place (finally!).