New! LinkedIn Chrome extension
Your business’s performance at a glance.
Copper Sales Reporting gives you instant insight into your pipeline, activities, and performance—fully customizable, deeply visual, and ready right inside CRM.











Copper Sales Reporting gives you instant insight into your pipeline, activities, and performance—fully customizable, deeply visual, and ready right inside CRM.











Copper is trusted by 30,000+
companies of all sizes

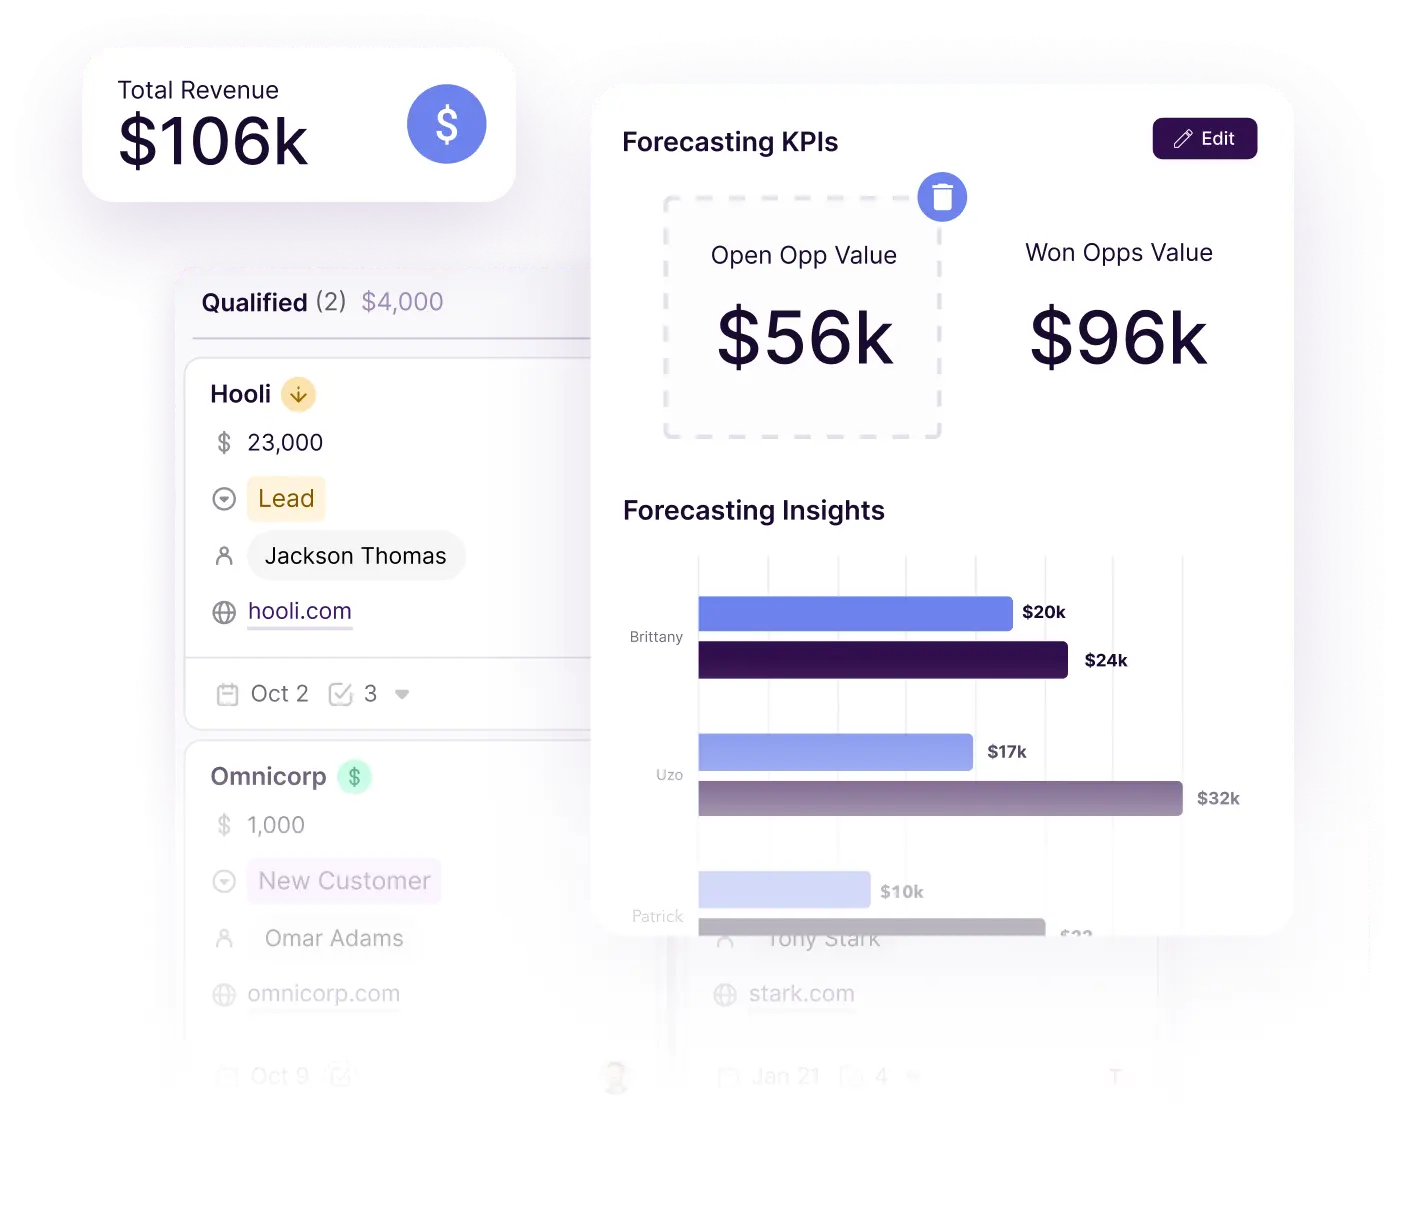
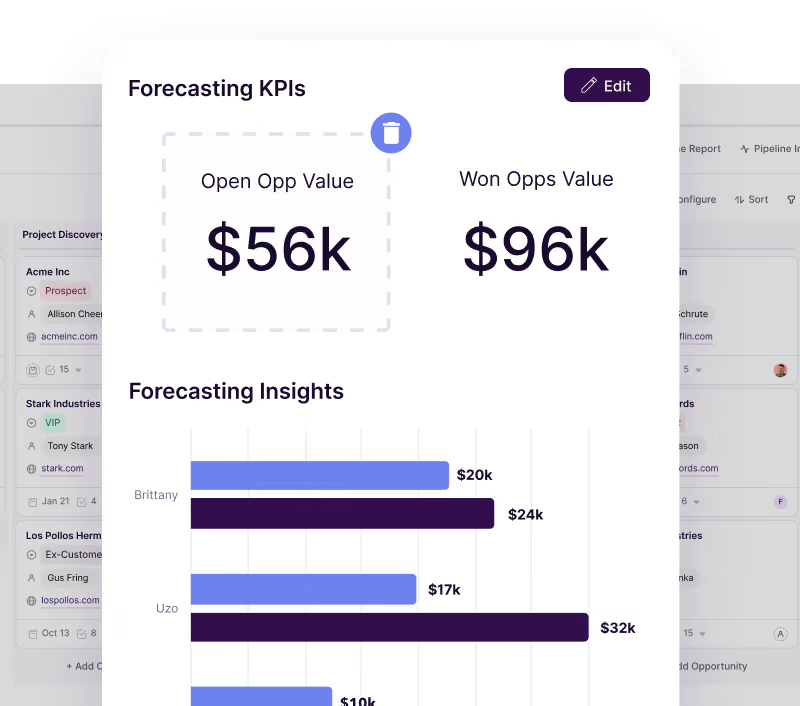
Personalize reports with custom fields, gain insights into deal length and inactivity, and easily identify top opportunities.

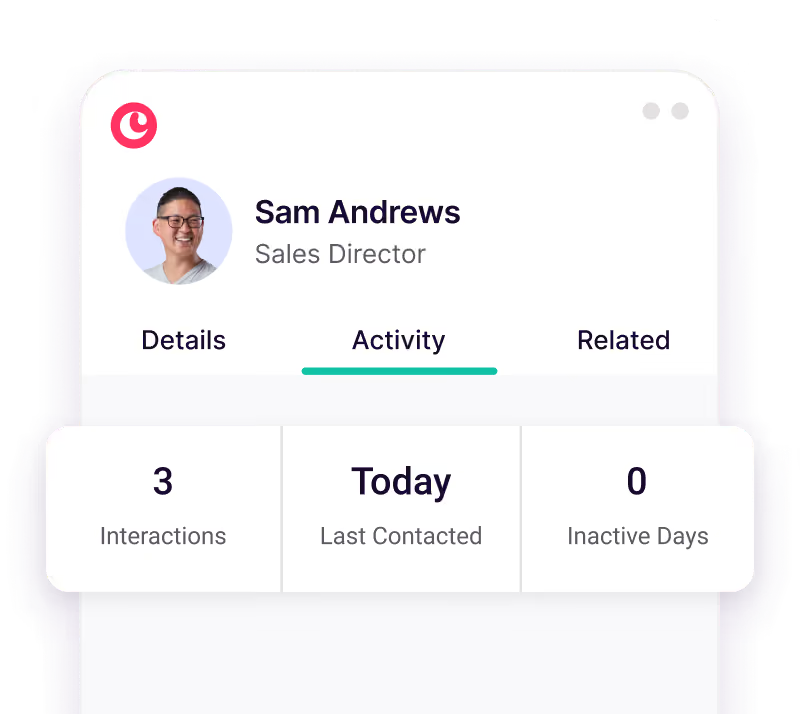
Spot relationships to nurture, prioritize outreach, and strengthen customer bonds.

Unlock deep visibility into your team’s activity and growth with accessible, high-impact reporting.
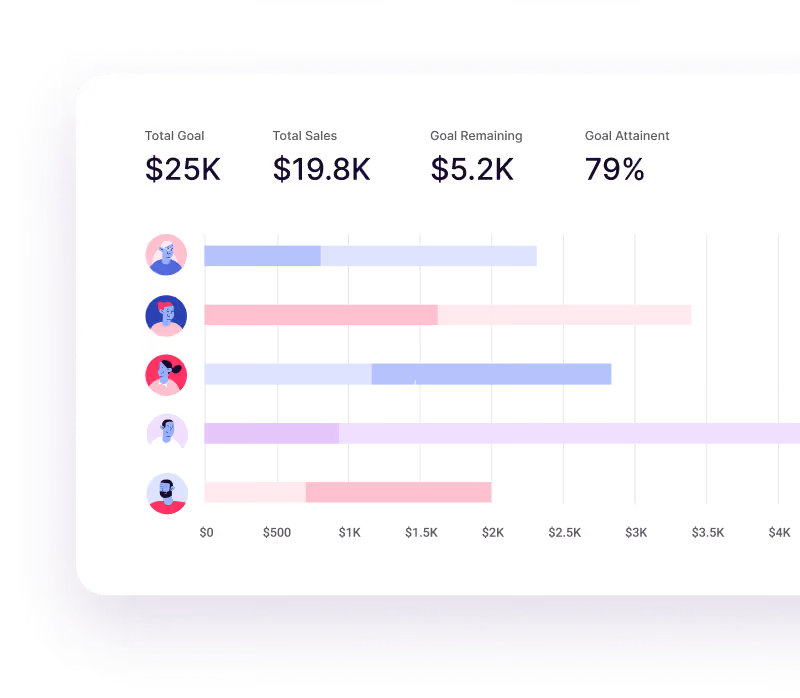

"With Copper, it’s the ability to internally link information, people, and content that is really unique where you can strategically analyze everything from different views."


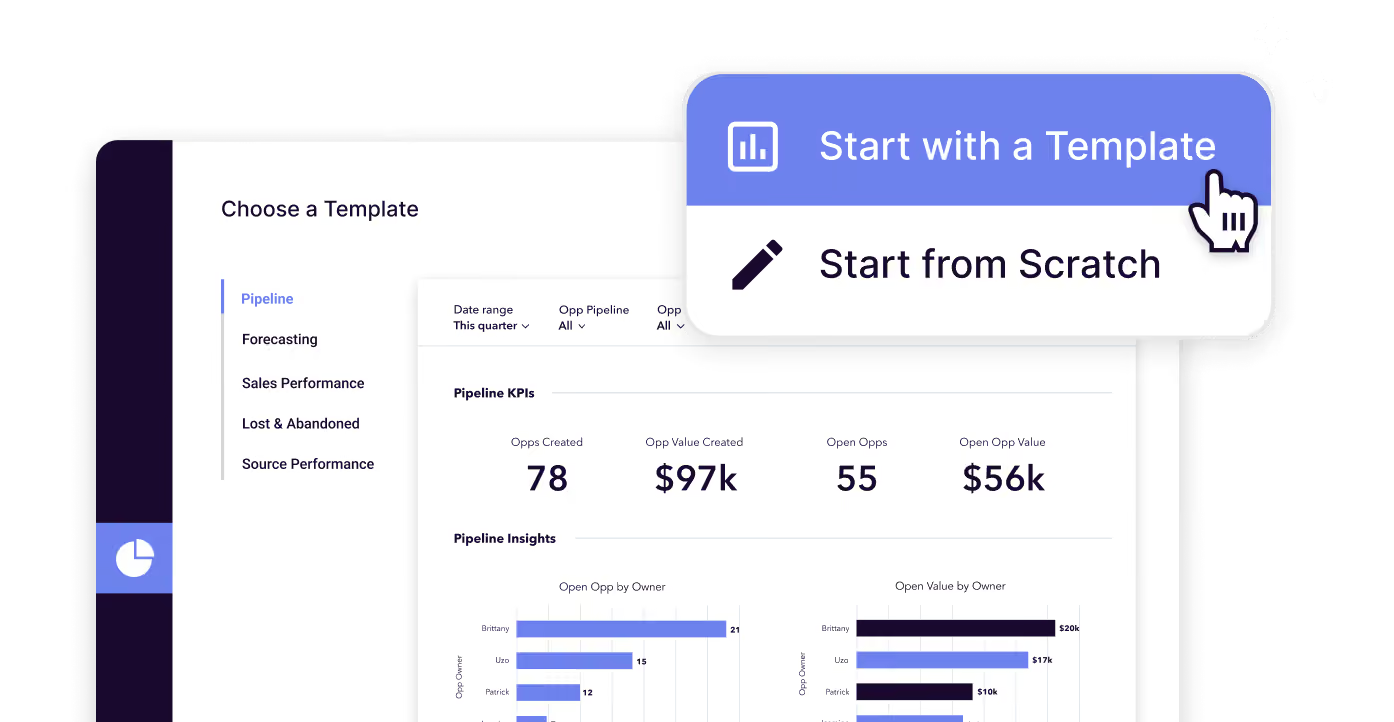
Launch one-click dashboards using pre-built layouts suited for common sales needs.
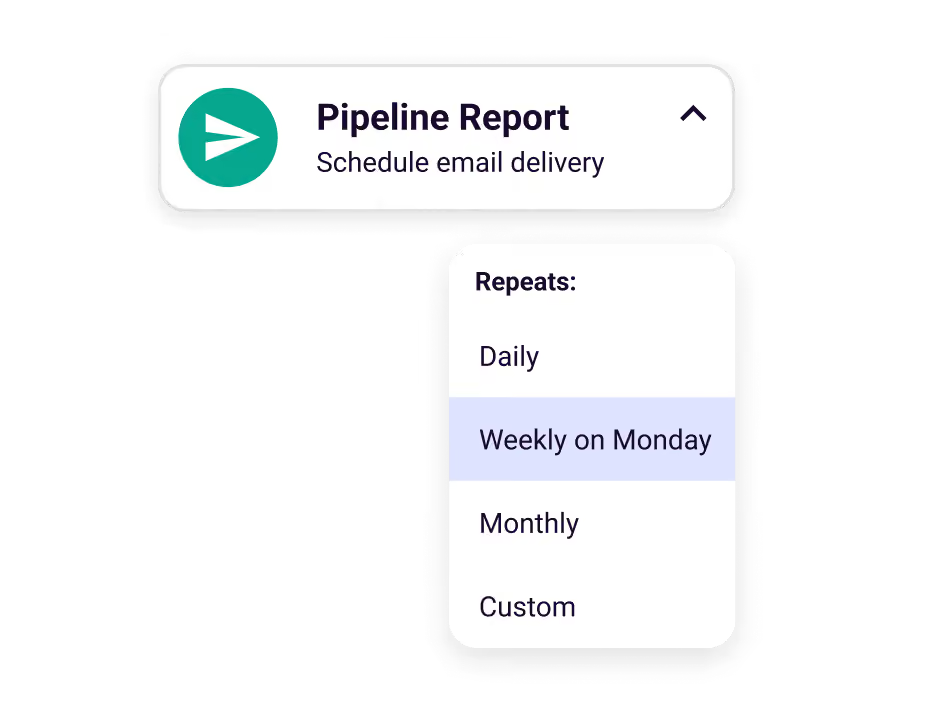
Automate report delivery, send alerts, or export insights, all without manual juggling.
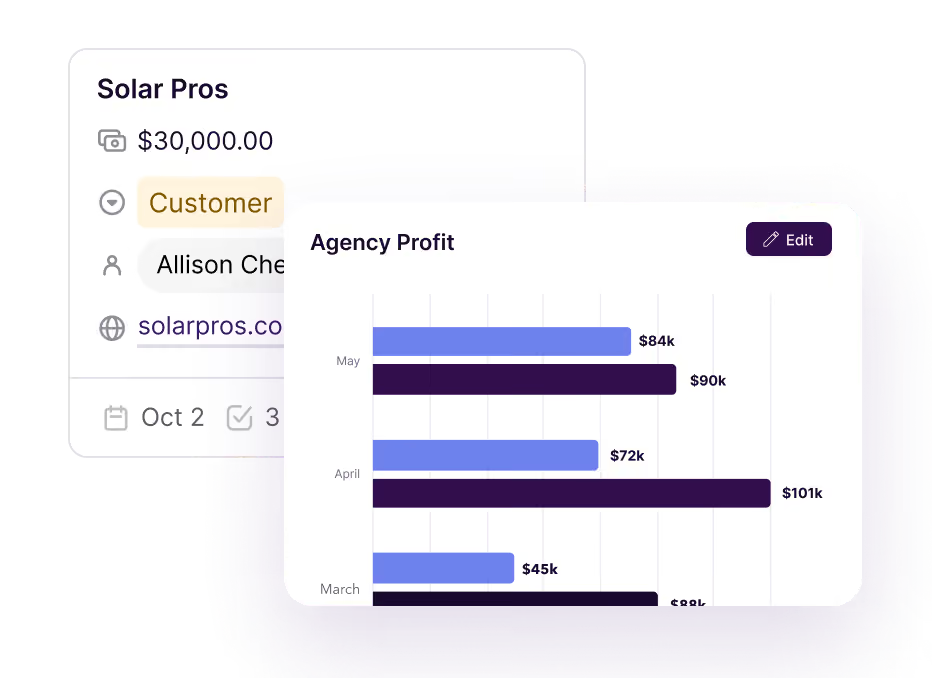
Create automations that calculate profits, commissions, and more. Feed the right metrics into Copper's reporting suite for more visibility.
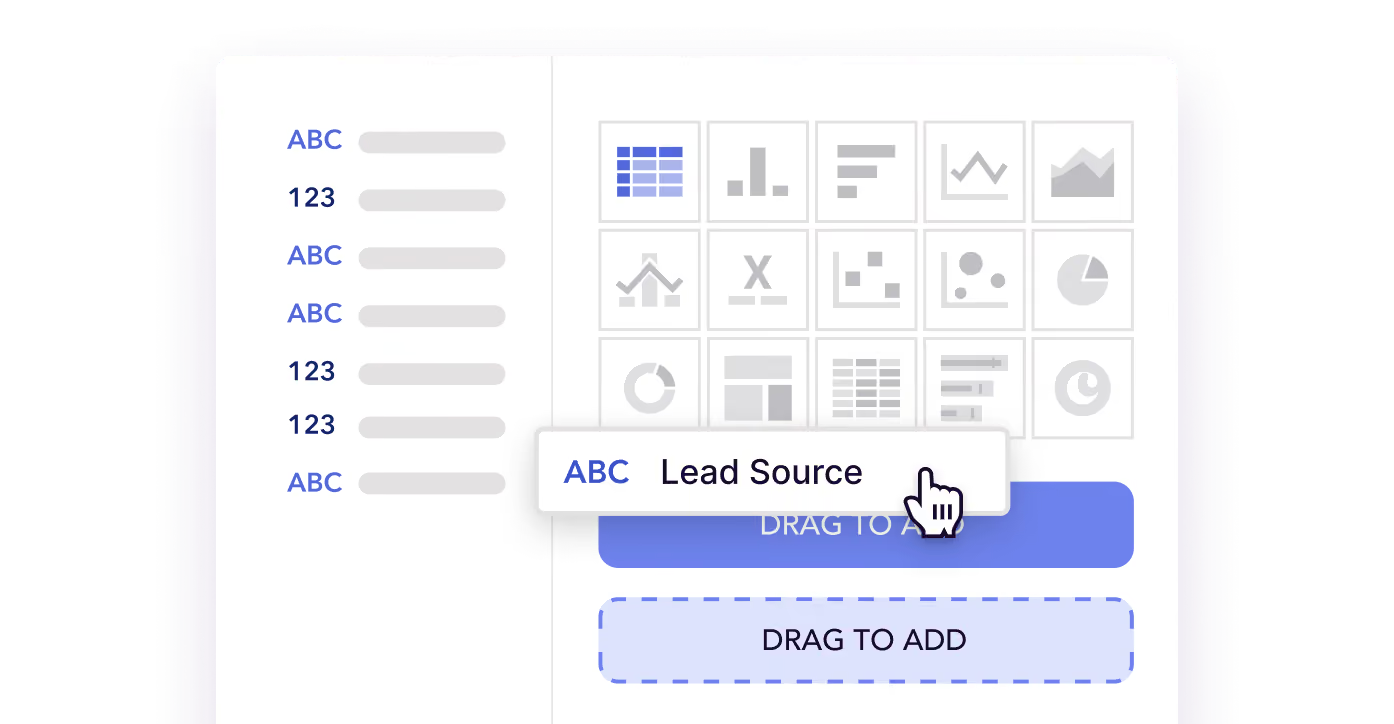
Modify KPIs, apply filters, rearrange charts, and define insights — all tailored to your workflow.
"Copper is a core part of how we’ll scale and grow. It gives us the data insights we need to get where we want to be."

Copper is purpose-built to help relationship-focused businesses manage their entire customer journey.


See how your sales number is tracking and where you’re going to end up compared to your goal.

See trends in your closed business with a sales history dashboard that shows average monthly sales and sale value.
See your potential revenue by expected close date, keep a pulse on your pipeline, and plan ahead.

Track lead conversion rates to spot the difference between high- and low-quality leads.

Know who your top performers are by tracking win rates by individual or by team.

Copper helps you understand why you’re losing deals and make adjustments in your strategy.

"Copper is the best CRM and project management tool I have ever worked with."
"An excellent tool to optimize opportunity management and strengthen customer relationships.""I love that it syncs to our Google Workspace environment. Having all of that information on a record is truly helpful to gain insight on our relationship with a customer."
"It has given me clarity about my pipeline."
"Strong reporting for sales performance, lost and abandoned sales and marketing effectiveness."
"Copper’s reporting and insights help you make smarter business decisions. See which clients need attention, track revenue opportunities, and monitor team performance—all in just a few clicks."
"It has given me clarity about my pipeline."
"Strong reporting for sales performance, lost and abandoned sales and marketing effectiveness."
"An excellent tool to optimize opportunity management and strengthen customer relationships.""I love that it syncs to our Google Workspace environment. Having all of that information on a record is truly helpful to gain insight on our relationship with a customer."
"Copper is the best CRM and project management tool I have ever worked with."
"Copper’s reporting and insights help you make smarter business decisions. See which clients need attention, track revenue opportunities, and monitor team performance—all in just a few clicks."
Take Copper for a spin first. Pay and add your team later.