Arrow pointing to left
All posts

Sales - 8 min READ

3 Data-driven Sales Forecasting Techniques (Using Just Your CRM)

Copy blog urlTwitter share logoLinkedin share logoEmail to logo
Article featured image
Author photo: Jess Day

Jess Day

Long before he took over as Peakon’s Chief Revenue Officer, Neil Ryland worked as a sales rep for cloud collaboration company, Huddle.

In the fall of 2010, Ryland was called to an all hands meeting in the company’s San Francisco office. The atmosphere was grim from the moment he walked into the conference room. Everyone was avoiding eye contact. No one made small talk.

“We missed our projected revenue numbers by 40%,” said Huddle’s CEO. The news fell like a lead weight. Missing by a couple percentage points is bad, but missing by 40%? Disaster.

Huddle’s business strategy relied on hitting those revenue goals. They’d opened new offices, hired new reps and invested in a fancy London headquarters. Every single decision made in the last year had been based on thousands of dollars in revenue that simply wasn’t there.

The question on all their minds was, “How could we get our sales forecast so wrong?”

Ryland’s story illustrates just how important accurate forecasts are. With poor forecasts (or no forecasts at all), executives make business decisions in the dark. And that can lead to ill-advised expansions, premature recruitment or poorly planned marketing strategies.

However, if you nail your forecasts, it’s like running your business with the assistance of a crystal ball.

Say your forecasts show that your sales team will hit capacity in six months. You can start the hiring process now so your new reps are ready as soon as you need them. Likewise, if you forecast a drop in sales in a particular market, you can invest in a new marketing campaign to drum up new leads.

In this article, we’ll look at three different sales forecasting techniques that use nothing more than the data in your CRM to produce accurate forecasts for your business.

Opportunity stage forecasting

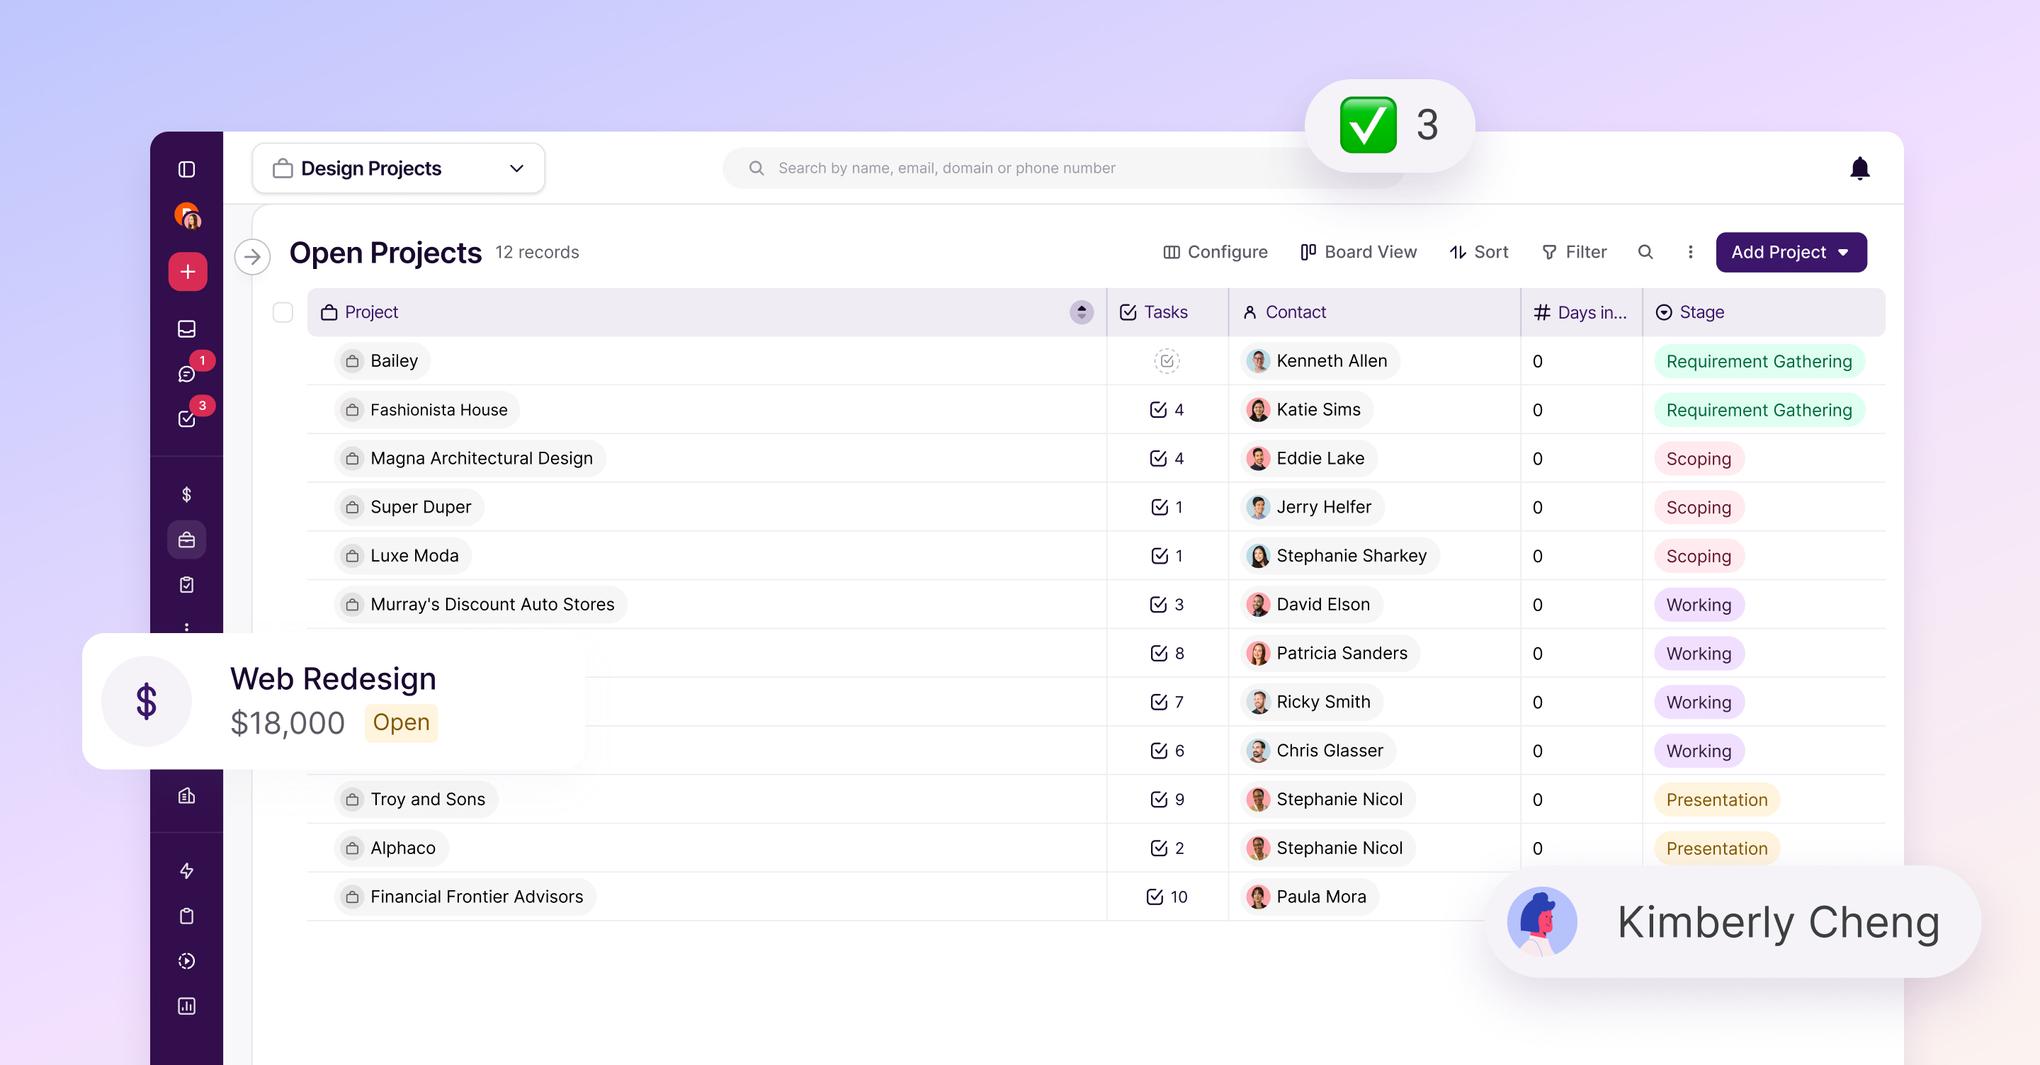
Each sales team has a unique series of stages a prospect passes through on their way to becoming a customer. You probably know it better as a sales pipeline. Most sales reps will replicate their sales pipeline in their CRM, allowing them to move opportunities from one stage to the next as they progress down the pipeline.

A common pipeline might look like this:

In this sales pipeline, an opportunity starts off with a project discovery call and finishes after the negotiation stage.

(Your specific pipeline stages will almost certainly be different since they’re based on your specific sales process.)

Since your CRM tracks how many opportunities enter and leave each stage, you can calculate the probability of closing an opportunity wherever it is in the pipeline.

For example, you might historically have a 10% chance of closing a prospect in the Project Discovery stage, a 20% chance in the Scoping stage and a 50% chance in the Proposal stage. Typically, the probability gets higher the further down the pipeline you go.

While most sales managers have this information in their CRM, few think to use it to calculate their sales forecasts.

Let’s look at an example.

Picture a company called Design Labs that sells cloud CAD software to product designers, architects and engineering firms. Design Labs’ sales manager has been struggling to accurately forecast sales, so she decides to test out the opportunity stage forecast method.

She starts by exporting all the sales pipeline data from the CRM and dumps it into Excel or Google Sheets. This reveals the total value of work in each pipeline stage. The next step is to multiply the total value of each stage with the probability of closing each opportunity, resulting in a forecasted value for each pipeline stage.


Opportunity Stage

Value

Probability

Forecasted Value

Prospecting

$200,000

10%

$20,000

Qualification

$100,000

10%

$10,000

Value Proposition

$120,000

50%

$60,000

Proposal

$80,000

75%

$60,000

Negotiation

$75,000

90%

$67,500

Closed

$50,000

100%

$50,000

When the sales manager adds up the forecasted values, she gets an accurate idea of how much money should come in when all the leads currently in the sales pipeline trickle through.

In this case, the opportunity stage forecast sits at $257,500.

Opportunity stage forecasts are attractive because they’re easy to implement and all the data you need is already in your CRM.

However, they do have one key drawback. Opportunity stage forecasts are built solely on historical data, so they ignore current market conditions. And that brings us to our next technique: category forecasting.

Category forecasting

So far, we’ve looked at opportunity stage forecasts, which give you a quick but generally accurate sales forecast based on the amount of work in your pipeline and your past performance.

However, opportunity stage forecasts ignore what’s going on right now. Just because your reps closed 50% of opportunities in the Proposal stage last month doesn’t mean they can do the same this month. The market might have been stronger last month, seasonal demand might have been higher, marketing might have launched a new campaign and so on.

While they're effective, opportunity stage forecasts ignore a brilliant source of knowledge: your sales reps.

Since your sales reps personally deal with each opportunity, they have a much more nuanced feel for whether or not the opportunity will close.

Let’s look at how this would work with Design Labs.

To get started with category forecasting, our sales manager goes into the CRM and adds a required field called Rep Forecast. The field has a few category options that summarize how a rep feels about the particular opportunity.

Common categories include:

  • Closed: These deals are signed off and won.
  • Commit: These are deals the rep is confident they can close in the time frame.
  • Possible: These are deals the rep is likely to close if everything goes right.
  • Pipeline: These deals are all the remaining opportunities in the pipeline.

Once the sales manager has set up the new field, she asks all the reps to update the category every time they move the opportunity to a new pipeline stage. Here are two examples of deals that Design Labs’ sales reps might deal with.

  • Deal #1: “I was only passed the lead last week, but the prospect seems very eager to proceed with the deal. They have the authority to sign off on the sale and are chasing me for a proposal.”
  • Deal #2: “I’ve been working on this opportunity for a while, but the prospect has been away on holiday and seems to have forgotten about my offer. I’ve convinced him to take a look at a proposal but it’s likely that I’ll have to warm him up again.”

The sales reps should mark the first deal as Commit as the prospect is actively trying to sign off on the deal. On the other hand, they should mark the second deal as Possible since the prospect might sign off but a lot of things would need to go right for that to happen.

The precise categories you use might vary, but the basic premise is the same: your sales reps make informed judgment calls on each opportunity’s readiness to buy.

When Design Labs’ reps have classified all their opportunities, the sales manager can start producing forecasts by adding different combinations of categorized deals. Here are the most popular category forecasts.

  • Worst Case: Worst case is the minimum revenue that you expect to generate. It’s the sum of your Closed and Commit categories.
  • Most Likely: This is the revenue forecast you reasonably expect to be generated. It’s the sum of your Closed, Commit and Possible categories.
  • Pipeline: This is all the revenue that’s on the table. It’s the sum of all Closed, Commit, Possible and Pipeline categories.

Category forecast models are popular with sales managers looking to tap into the knowledge of their team. Since they deal with the specifics of individual deals, they also tend to be a bit more nuanced than opportunity stage forecasts.

Regression analysis

As we have seen, calculating an accurate sales forecast is really difficult to do. At any one time, there are dozens of different factors (for example, advertising spend, market demand, economic growth and so on) that combine to influence your next month’s numbers.

Regression analysis is simply a way to test which of those factors actually influence your business performance. To put it technically, regression analysis tries to draw a link between two variables: the dependent variable and the independent variable. The dependent variable—you guessed it—depends on the independent variable. Here are a few examples of each.

  • Dependent Variable: Revenue, Footfall, Clicks, Demos, Meetings
  • Independent Variable: GDP, Weather, Resource Prices, Advertising Spend

Let’s see how regression analysis works at Design Labs.

Our sales manager starts by collecting as much data on her dependent variable as possible. In this case, she’s interested in revenue, so she goes into her CRM and exports all the sales data for the past three years.

Next, she needs data on the independent variable that she wants to test. Let’s say our sales manager wants to investigate GDP growth, so she downloads the quarterly U.S. GDP growth statistics for the past three years.

Once she has the sales data and GDP growth data, she imports both files into a statistics program like STATA or Excel and plots the two data sets on a graph.

A statistics program will produce a graph like this one with each variable plotted on one axis.

The red line shows the relationship between the two variables. In this case, there is clearly a correlation between GDP growth and Design Labs’ sales performance. As GDP growth rises, so do their sales.

This is a pretty simple example. Usually, sales managers will test several independent variables (like product price, economic conditions, weather, and government incentives) and several dependent variables (like emails, demos, meetings, sales, and revenue) at one time.

Testing multiple variables allows you to compare different relationships and pick out the strongest links. Once you know which factors most influence your sales performance, you can index an earlier forecast (opportunity stage forecast, category forecast or something completely different) for more accurate predictive forecasting.

Make better sales forecasts with your CRM.

As we saw in Neil Ryland’s story, poor sales forecasts can lead to executives making poor business decisions. An accurate sales forecast is like a compass: it shows you where your business is going and helps you make smarter, more informed choices.

Here’s a recap of how you can use your CRM to make better sales forecasts.

  • Calculate a win rate for each pipeline stage, and work out the predicted value of all the work in your pipeline. (This win/loss checklist can help.)
  • Tap into your reps’ knowledge, and ask them to update opportunities based on their win probability.
  • Compare an independent variable to your sales data to identify dependent relationships.

Want to see how Copper can supercharge your sales forecasts? Learn all about useful forecasting features.

Try Copper free

Instant activation, no credit card required. Give Copper a try today.

Ideo graphic
Masterclass graphic
Swell graphic
Bubbles graphic
Try Copper free image

Keep Reading

All posts
Arrow pointing to right
Featured image: Copper CRM product principles … 2023 and beyond

6 min READ

Copper CRM product principles … 2023 and beyond

How and why Copper defined our CRM product principles, and why we think they’ll make a difference for our users.

Featured image: An easy way to track your critical workflows

6 min READ

An easy way to track your critical workflows

Building the right pipeline structure in your client relationship system, for sales or non-sales workflows, can help you better manage key processes. Here's how.

Featured image: How to get more leads and hit your sales quota

3 min READ

How to get more leads and hit your sales quota

Skip the looming dread of missing your sales quota with these expert tips on how to get more leads.

Featured image: Case study: SportsDataIO powers a personalized email marketing strategy with Copper X Mailchimp

2 min READ

Case study: SportsDataIO powers a personalized email marketing strategy with Copper X Mailchimp

Fast-growing sports data provider added our Mailchimp integration to Copper CRM to power up their email marketing with personalized newsletters.