


The data generated by sales teams is like the water moving a fire hose. Untamed, it makes a big mess. But it can accomplish great things when it’s focused on a goal.
It’s easy to get overwhelmed by the immense amount of information generated by the sales process:
- Every rep’s calls and emails are logged (and often recorded).
- Each sale is cataloged and analyzed.
- Team trends are calculated.
- Product lines are monitored.
- Forecasts are made for teams, reps, products, and the company at large.
That’s gigabytes of data stored every week. And it’s all useful. But how do you make sense of it? You need a quick way to see what’s important without digging into massive spreadsheets of numbers. That’s where sales dashboards come in.
There are many kinds of sales dashboards. But they all have the same goal: to show you useful sales data in a compact space. They help guide reps, managers, and executives when making decisions. And they save you lots of time.
Let’s take a look at the basics of sales dashboards, including:
- what sales dashboards are exactly,
- how to create a sales dashboard, and
- the 10 elements that are crucial to a dashboard
What’s a sales dashboard?
A sales dashboard is a single page that presents sales data in a compact space. It might include the total monthly sales for your team, the number of deals closed by each salesperson on the team, and forecasted sales for the quarter. It can contain any piece of useful sales-related information.
This, for example, is a simple sales dashboard:
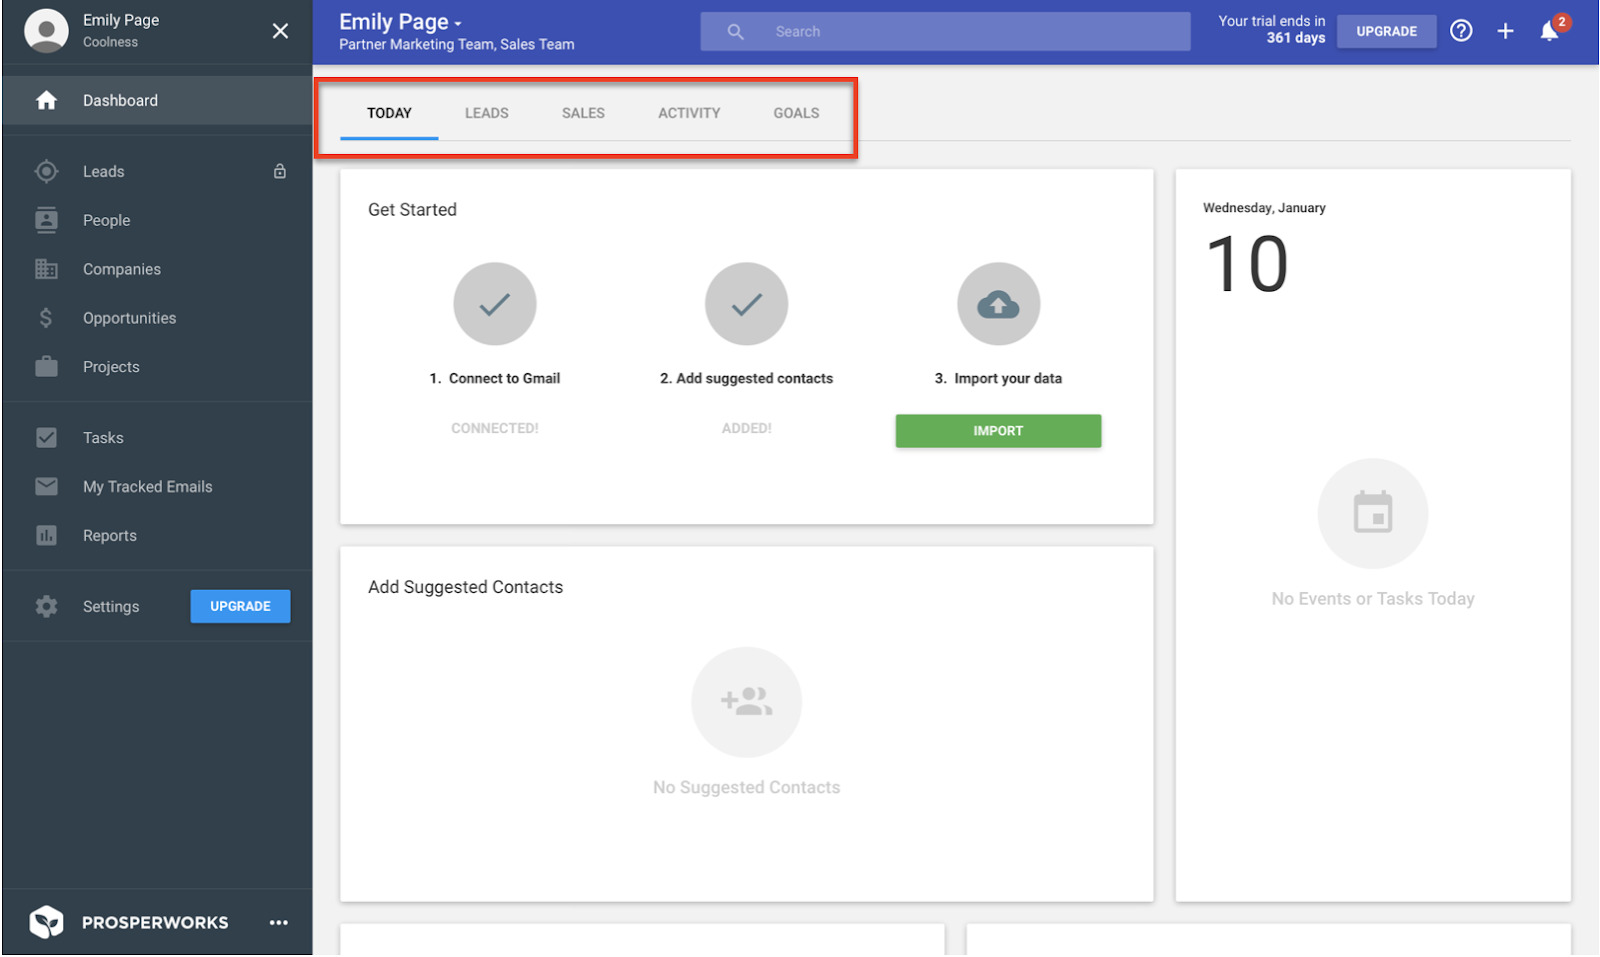
We’ll talk more about the kinds of information you might want to include a bit later.
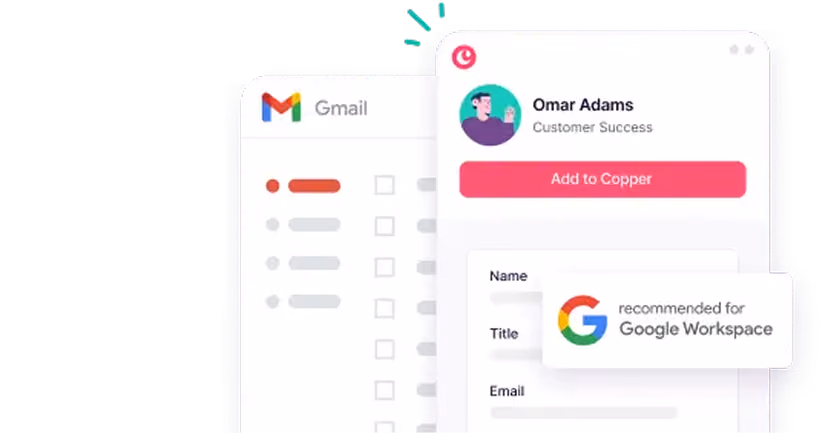
You can find sales dashboards in many places. Most often, they’ll be generated by your CRM. Because sales reps use CRMs to log calls, emails, sales, and lost deals, the software already has the necessary information for generating dashboards.
But there are other ways to create sales dashboards. There are third-party software packages that link with your CRM and other data sources to create dashboards, for example.
You could even have a printed sales dashboard posted on the wall of your office . . . but that requires a lot more effort.
No matter how you generate them, sales dashboards are useful to many people:
- Sales reps see how they’re progressing toward their quotas.
- Managers see how the team as a whole is performing and if any outliers are helping (or hindering) progress.
- Executives see how sales compare to forecasts and goals.
Dashboards show a lot of information in a compact space. But it’s easy to go overboard and include too much information.
Let’s talk about the questions you should ask when creating a sales dashboard.
How to create a sales dashboard
The exact process you’ll use to create a sales dashboard depends on your CRM. But you need to think about a few things before you start putting the dashboard together.
Here are three questions that will inform your sales dashboard:
1. Who will use this dashboard?
Because sales CRMs make it easy to create dashboards, your answer doesn’t have to be “everybody.” It might be “sales reps.” Or “east-coast sales managers.” It might even be “just me.”
Your answer will determine which elements to include in the dashboard.
For example, if you’re making a dashboard for your sales reps, you might not include a graph that shows the performance of the whole sales team compared to last year. Showing the sales reps their progress toward their own quotas would be more useful.
If you’re building a sales dashboard for an executive, you’ll want higher-level information like profitability, ROI, forecasts, and so on.
Some dashboards will include both high-level and more granular information. That’s fine. Just make sure that you’ve given some thought to who will be using the dashboard so you can best answer the next question.
2. What information do those people need?
Now that you know who’s going to use the dashboard, you can think about what information will be most useful to your audience. We talked about some of the general patterns in the point above. But now let’s get into specifics.
The key performance indicators (KPIs) that any dashboard has are specific to your company. But you can look at a few example sales dashboards to get an idea of what you might include.
Here’s an example dashboard for a sales manager:
- Monthly revenue
- Progress toward quarterly quota
- Revenue forecast
- Sales leaderboard
- Total call/email volume
- Average time to close
Compare that to what you might see on a dashboard for a sales rep:
- Individual monthly revenue
- Progress toward monthly quota
- Win/loss rate
- Individual average time to close
- Number of lost deals
You get the idea. Individuals might look mainly at elements that are relevant to them, whereas managers care more about elements that are relevant to the team. Executives can focus on elements that are relevant to the company at large.
That can be a lot of information, though. It’s time to think about how to keep the dashboard compact (and useful).
3. What’s the most efficient way to present this information?
A cluttered dashboard tries to put too much information into a small space. It’s messy and makes it hard for readers to get the information they’re looking for. In short, it negates the benefits of having a dashboard.
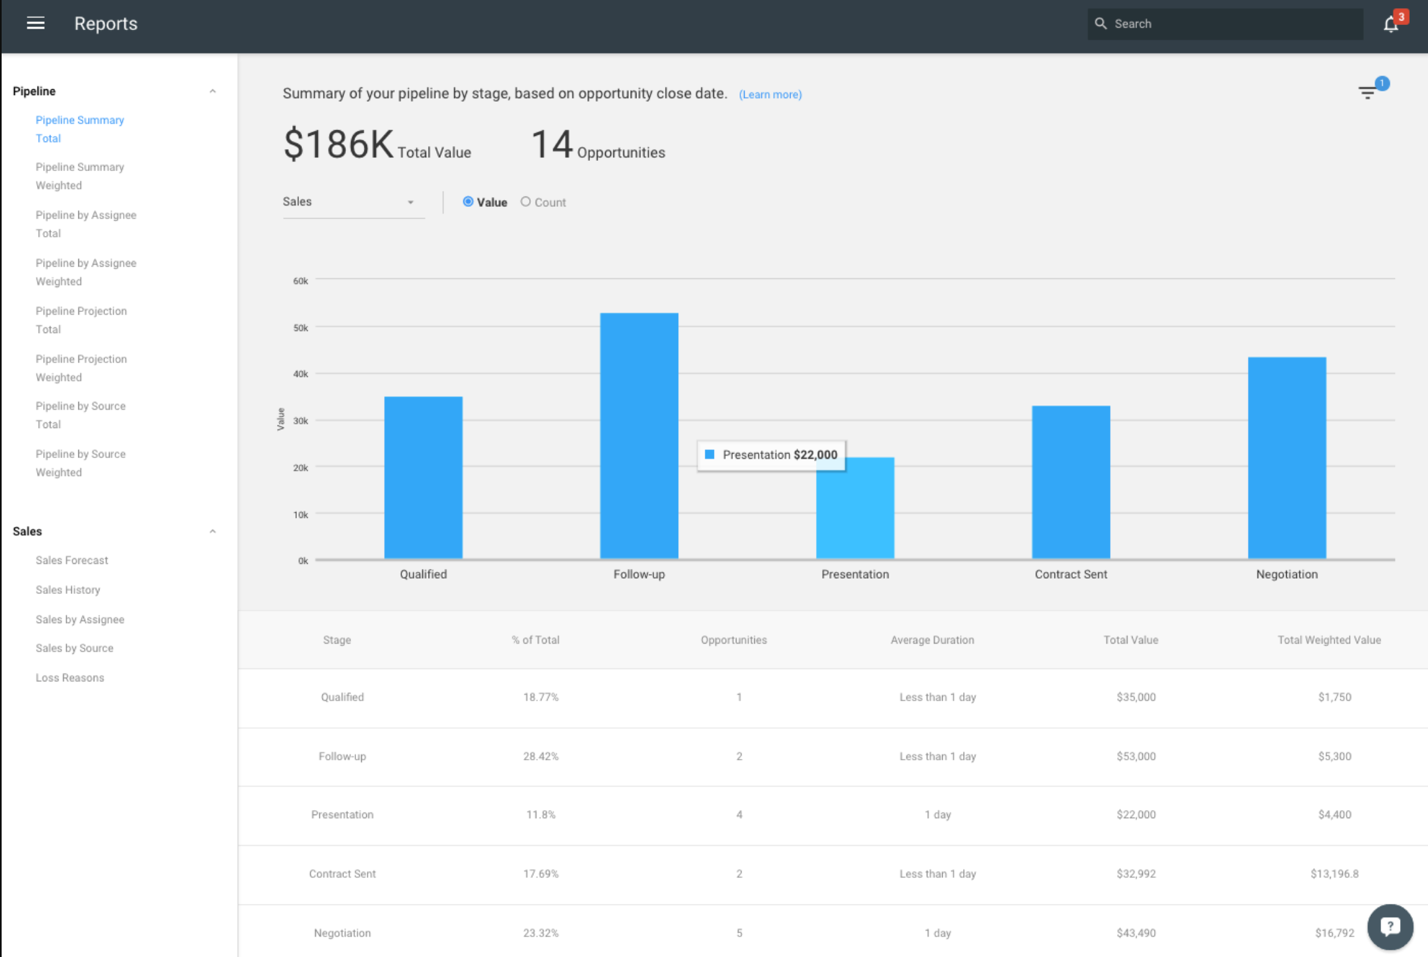
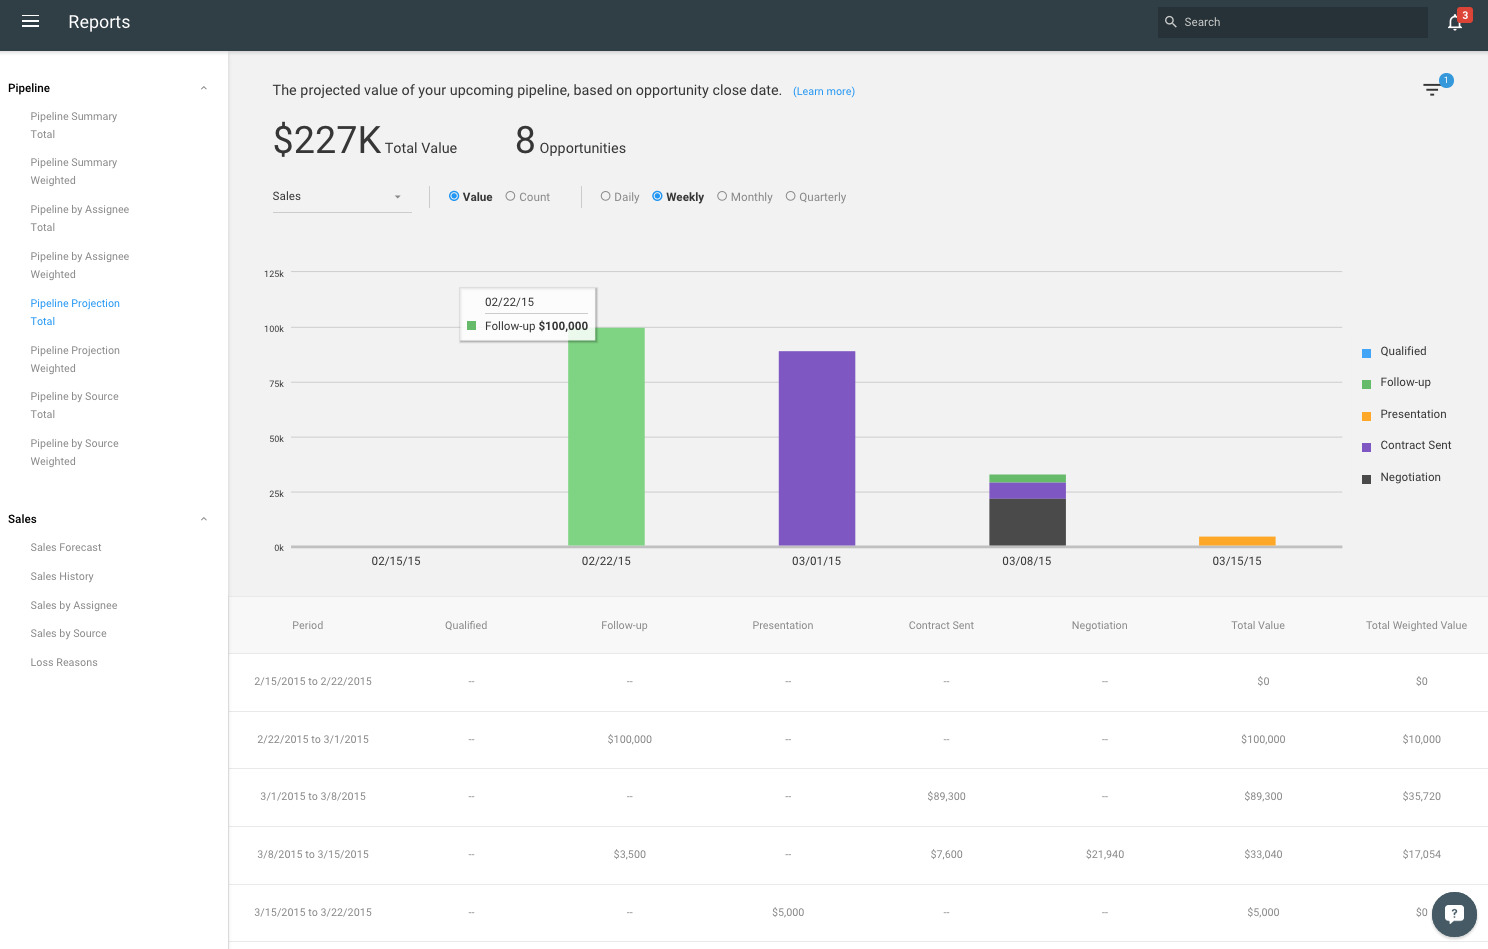
Instead of including as much information as possible, focus on the most important KPIs. Then see where you can combine them. For example, you might show the sales forecast next to your pipeline summary:

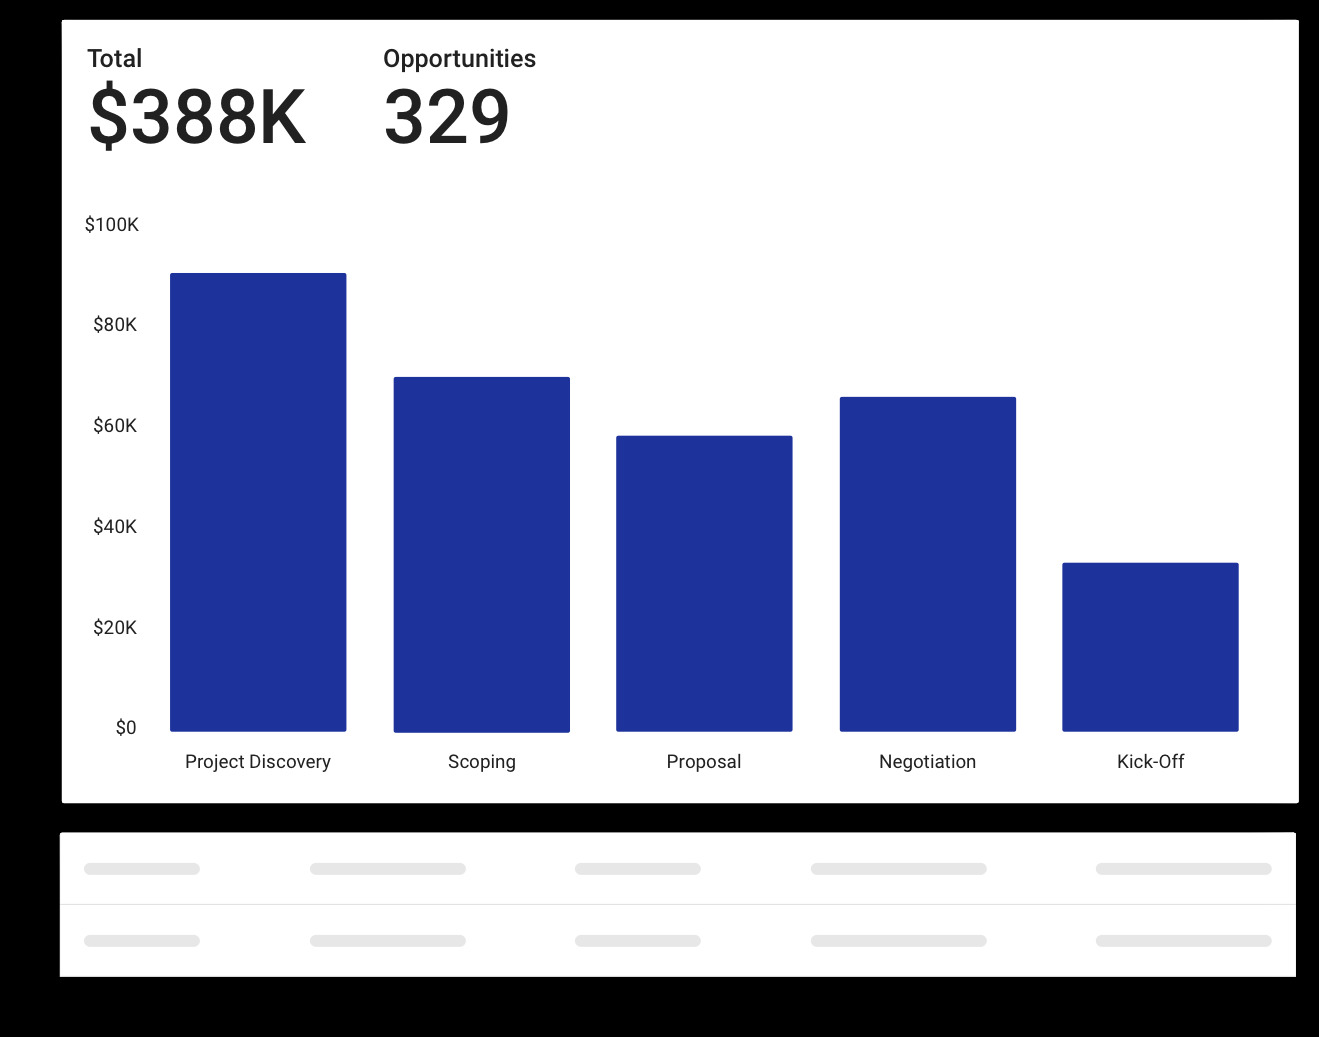
You can also use different formats for the data. Current revenue might be shown as a single number because it’s a straightforward measure. But your pipeline is more clear when it’s shown as a series of bar graphs:
And if you want to split that up by sales rep, a segmented bar graph might be better:

Because sales CRMs are flexible, you should be able to create a dashboard that presents information as efficiently as possible.
What elements should a sales dashboard have?
We’ve talked about the types of information you might put into a dashboard. Now it’s time to get down to specifics.
Here are 10 KPIs to consider adding to your sales dashboards:
Revenue
This is the ultimate measure of your sales program. How much money are you bringing in? You’ll see revenue listed as one of the first metrics on any dashboard.
The specific measure might vary—do you want to see the amount of revenue you’ve brought in this month? This quarter? This year? It may depend on who will be using this particular dashboard.
Quota/goal progress
Sales reps have monthly quotas. Sales managers have quarterly revenue goals. Executives set yearly goals based on previously forecasted data.
Dashboards help all of them see progress toward those goals. Nearly every sales dashboard can benefit from a KPI like this one. The specific measure you use depends on the audience of the dashboard.
Team leaderboard
Every member of your sales team is working toward the same goal—but a healthy sense of competition helps keep people motivated. A leaderboard helps foster that sense of competition.
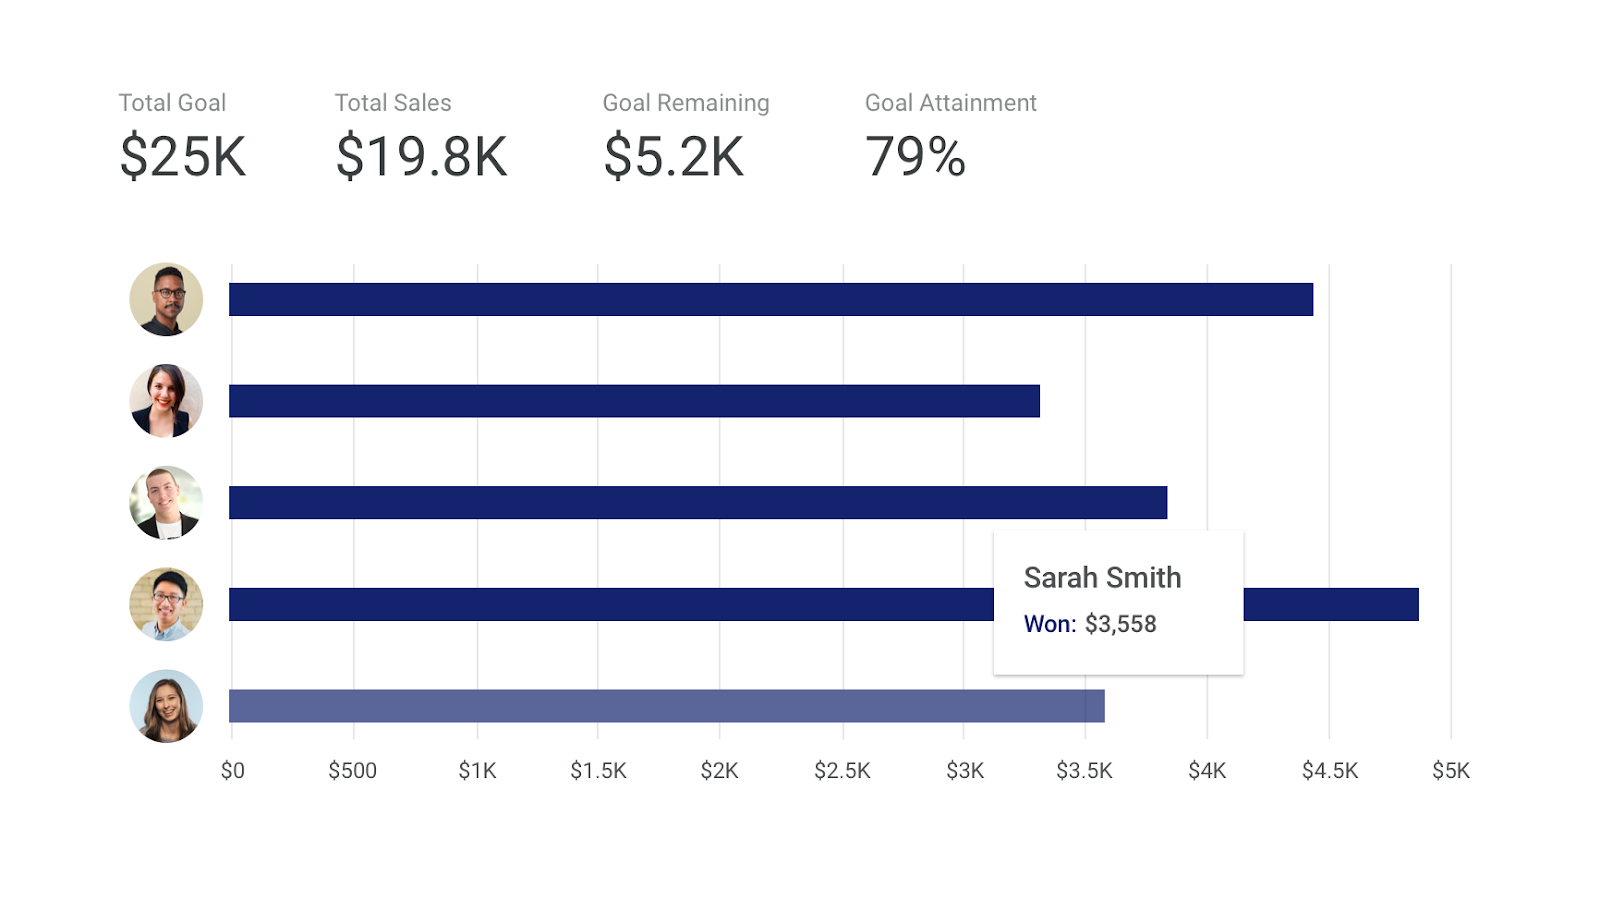
Who’s closed the most deals this quarter? Who’s brought in the most revenue this month? When shown to sales reps, it leads to fun rivalries. When shown to managers and executives, it indicates which reps are power players on the team.
Forecasted sales
Based on your sales team’s current performance, how much are you likely to sell this quarter? Managers and executives can use this to plan for the future.
And because many CRMs now handle the forecasting for you, there’s no need to dive into spreadsheets to come up with an estimate.
This forecast can be used to develop quotas and goals for your team. Setting aggressive goals based on previous forecasts is a great way to encourage your team to keep improving their performance.
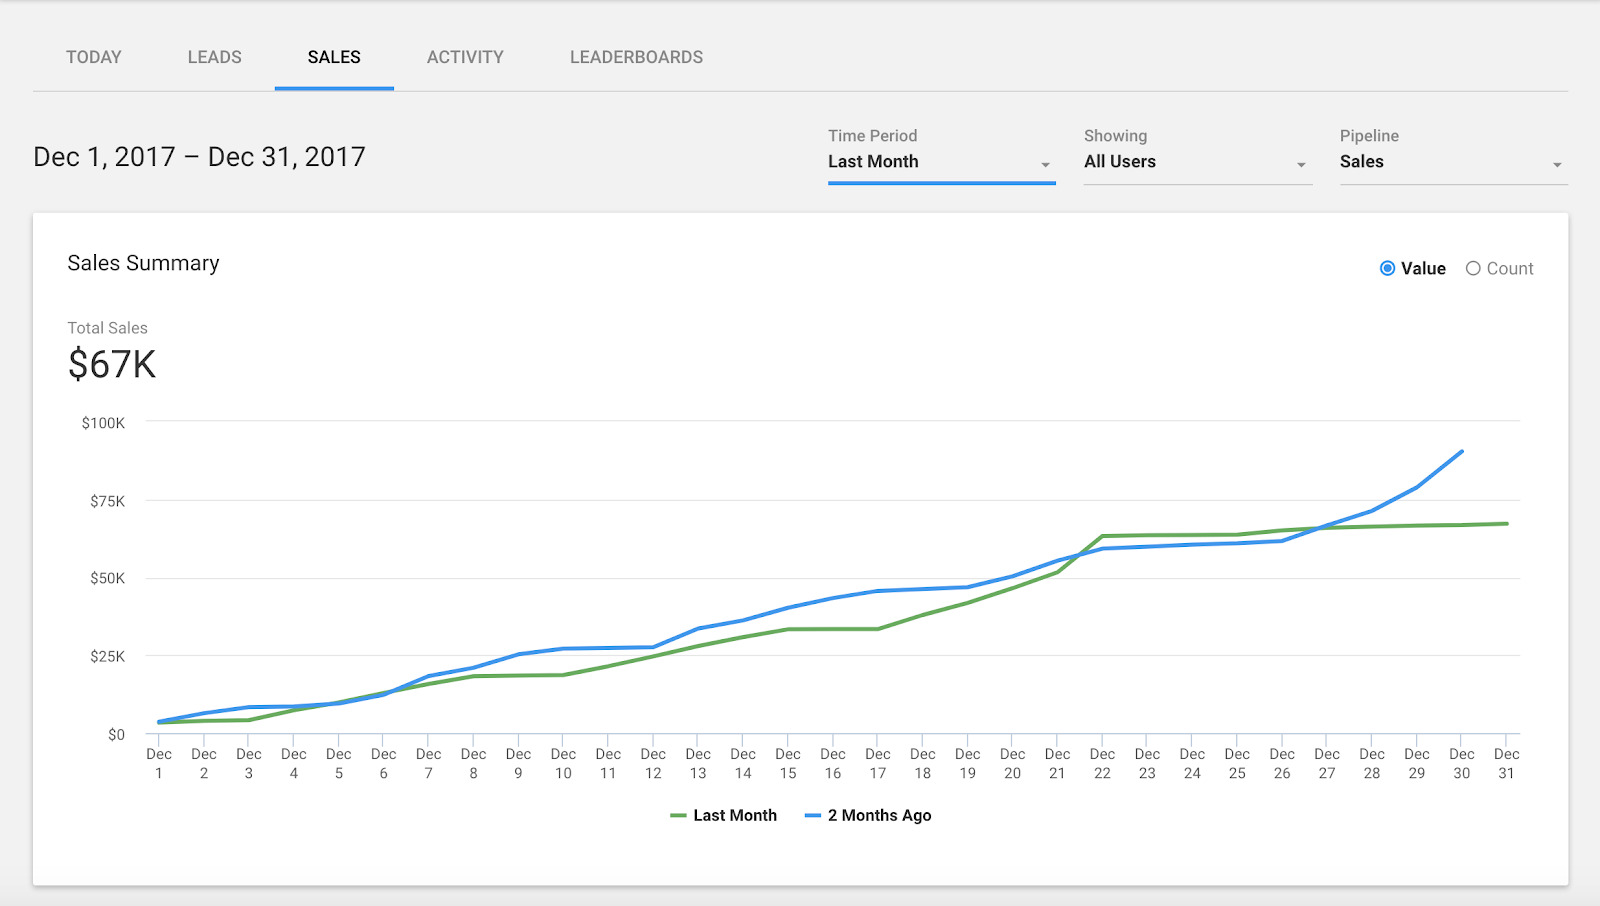
YTD vs. last year
Another way to encourage sales reps to improve is to compare your sales to the previous year’s.
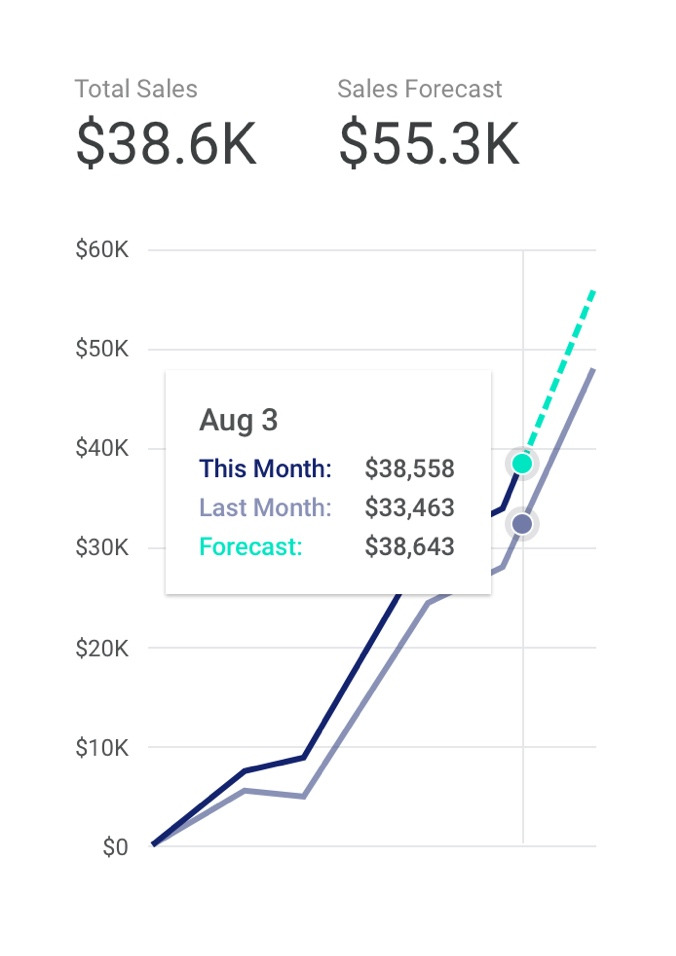
If you’ve sold more by a certain point in the year than you did at the corresponding point in the previous year, your team is improving. If you’ve sold less, it’s time to start looking for ways to stop the decline.
Sales funnel metrics
Your sales funnel is the lifeblood of your sales process. Without leads and opportunities coming in, your salespeople won’t have prospects to sell to. Sales funnel metrics show you where leads, prospects, and other potential customers are in your funnel.
You might see this represented as an actual funnel, with the number of CRM entries in each stage noted next to different parts of the funnel. It might also include the number of open opportunities or breakdowns by lead source.
The exact information represented by your sales funnel metrics should be tailored to your sales team. Whatever information helps managers and executives see how your sales program is faring is worth adding to your dashboard.
Win/loss rate
How many opportunities are your salespeople converting to customers? The win/loss rate gives you insight into how effective your team is at getting sales.

Like revenue, this is a good KPI to watch over time. If your win rate rises, the team is getting more effective.
Sales cycle length
How long does it take your sales team to turn an opportunity into a sale? How many days pass between the first contact with a prospect and their conversion into a customer?
This is valuable information for forecasting, and is common in higher-level dashboards. It’s also a good one to watch for improvements or declines. The faster your team can close deals, the more revenue you’ll bring in.
Sales by product
Which of your products are responsible for the most revenue at your company? Knowing the answer helps you focus your team’s efforts where they’re most valuable. And it helps executives better plan for the business’s future.
This KPI might play a smaller role at smaller companies that only sell one or two products. But larger organizations that sell dozens or hundreds of products will gain more insight.
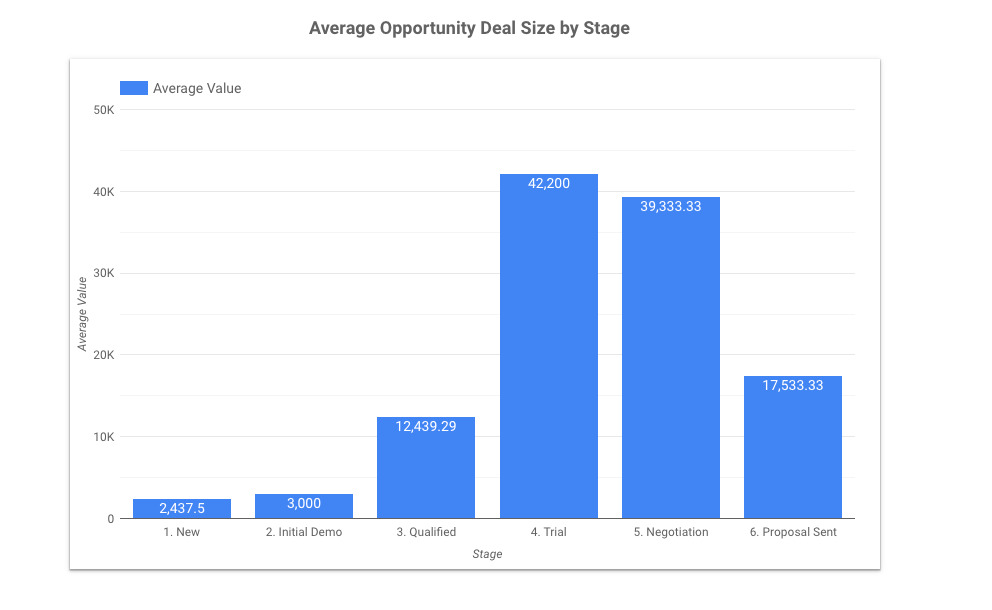
Average deal value
How much money does a single sale usually bring in? You can combine this information with other KPIs on your dashboard to get accurate forecasts of sales revenue for the future.
And, as you might expect, you can track it over time to watch for improvements.
Create your sales dashboard by getting the most out of your CRM.
Sales dashboards show you a lot of useful information in a small space. And you can use that information to guide your decision-making, whether you’re a front-line rep or a C-level executive.
Having fast and easy access to information is one of the best ways to get the most out of your sales CRM. The more you can rely on this data, the better decisions you’ll make. And that’s crucial for getting the most out of the money you spend on your CRM.
Want to learn other ways to get the most from your software?